Wallet timeframes (such as PnL and volume windows) are rolling periods. 1D is the last
24 hours, 1W is the last 7 days, and so on. They do not start at a fixed date or time
of day.
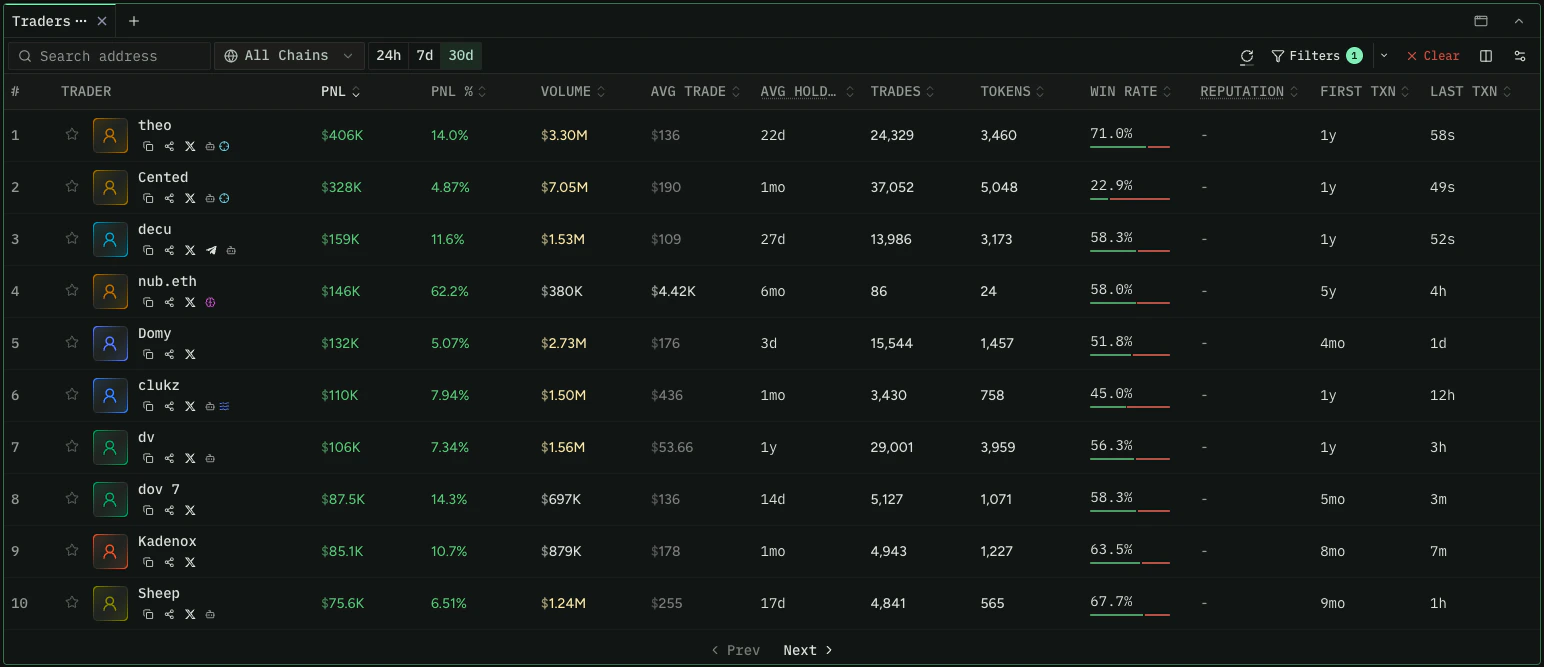
Filter by Performance
UsefilterWallets to surface wallets with strong trading performance. Combine numeric
filters with a ranking to sort the results.
All performance metrics are available across four windows: 1d, 1w, 30d, 1y.
Append the window to the metric name (for example realizedProfitUsd30d, winRate1w,
volumeUsd1y).
Test this query in the Explorer →
For a trade to count toward win rate, profit or loss must exceed $1 USD.
volumeUsd
only counts volume from tokens with a reliable USD price. Use volumeUsdAll to include
volume from tokens without one.Filter by Identity and Socials
Narrow discovery to wallets that have linked social accounts or a set display name. This is useful for surfacing public, identifiable traders rather than anonymous addresses. All identity filters accepttrue (must have) or false (must not have):
| Filter | What it checks |
|---|---|
hasTwitter | Wallet has a linked Twitter/X account |
hasDiscord | Wallet has a linked Discord account |
hasTelegram | Wallet has a linked Telegram account |
hasFarcaster | Wallet has a linked Farcaster account |
hasGithub | Wallet has a linked GitHub account |
hasDisplayName | Wallet has a display name set |
hasSocials | Wallet has any linked social account |
Sort by Ethos Credibility
ethosScore (0 to 2800) is a credibility score you can use as a ranking attribute to
surface reputable traders first. Combine it with identity filters to focus on wallets
with both a public identity and a strong reputation.
Test this query in the Explorer →
Sort and Filter by Average Hold Period
avgHoldPeriodSec estimates how long a trader tends to hold tokens, derived from their
buy and sell rate over a window. It is available in four windows (1d, 1w, 30d,
1y) and can be used as either a ranking attribute or a filter input.
Long-term conviction holders (longest hold period first):
Test this query in the Explorer →
Find Token-Specific Traders
To find profitable traders of a specific token, usefilterTokenWallets. Watch for
wallets that appear across multiple token queries, which can indicate consistent
performance.
Test this query in the Explorer →
filterTokenWallets accepts up to 50 token IDs per query. If you pass more than one
token ID, you must also include at least one wallet address. Records only update on
swaps, so wallets that received tokens via transfer (airdrops, direct sends) will not
appear. Use holders if you need an accurate holder
list updated on every transfer.tokenBalance reflects the wallet’s balance as of its last swap, while
tokenBalanceLive is the most up-to-date balance — prefer tokenBalanceLive when you
need a wallet’s current holding.Filter by Wallet Labels
Codex surfaces two separate label systems. They come from different sources and may overlap on individual wallets, so treat them as distinct.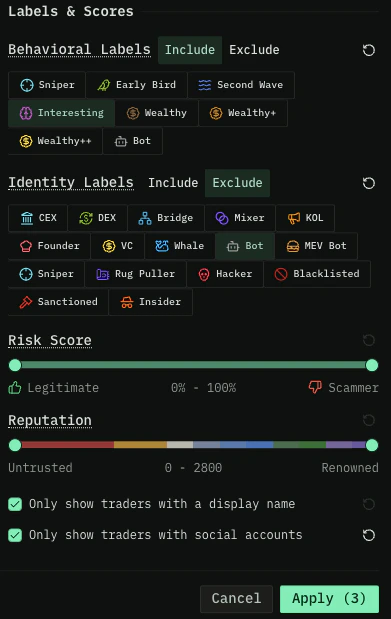
Codex behavioral labels
These are assigned by Codex based on a wallet’s on-chain trading activity. Apply them throughincludeLabels (only wallets matching) or excludeLabels (wallets to remove)
on filterWallets. The WalletLabel enum values:
INTERESTING— Wallet is interesting based on a number of factorsMEDIUM_WEALTHY— Wallet holds $5M+ in assetsMEGA_WEALTHY— Wallet holds $10M+ in assetsSMART_TRADER_TOKENS_OVER_TWO_DAYS_OLD— Over $7.5K profit in the last 90 days from tokens older than 2 daysSMART_TRADER_TOKENS_UNDER_TWO_DAYS_OLD— Over $5K profit in the last 90 days from tokens between 1 hour and 2 days oldSNIPER— Over $3K profit in the last 90 days from tokens launched within their first hourWEALTHY— Wallet holds $1M+ in assets
Identity labels
Codex also surfaces a separate set of curated identity labels from third-party data. These describe what the wallet is (CEX, KOL, founder, whale) rather than how it trades. They appear on thewallet.identityLabels array, and the full current
vocabulary is returned by the walletLabelTypes
query. See the reference page for the complete list with display names and
descriptions.
Three labels appear conceptually in both systems:
SNIPER, BOT, and SCAMMER. They
are curated separately (Codex on-chain analysis vs. third-party sources) and may flag
overlapping but not identical sets of wallets. A wallet may carry the behavioral
SNIPER label without the identity SNIPER label, or vice versa.Wallet category
Distinct from both label systems,wallet.category returns a single structural
classification of what kind of address a wallet is — for example NORMIE,
TOKEN_CREATOR, EXCHANGE, PAIR, or POOL_AUTHORITY. Where labels describe how a
wallet trades or who it is, category answers “what kind of address is this.” See the
WalletCategory enum reference for the full set of
values.
Related Endpoints
- filterWallets
- filterTokenWallets
- walletLabelTypes
- holders
- WalletLabel enum reference
- WalletCategory enum reference