> ## Documentation Index
> Fetch the complete documentation index at: https://docs.codex.io/llms.txt
> Use this file to discover all available pages before exploring further.
# Trader Dashboard
> Understand how to build a complete single-wallet view with the Codex API
Once you have a wallet of interest, this recipe shows how to pull together everything
you would display on a trader profile or dashboard: identity, performance stats, PnL,
charts, trading history, and current holdings.
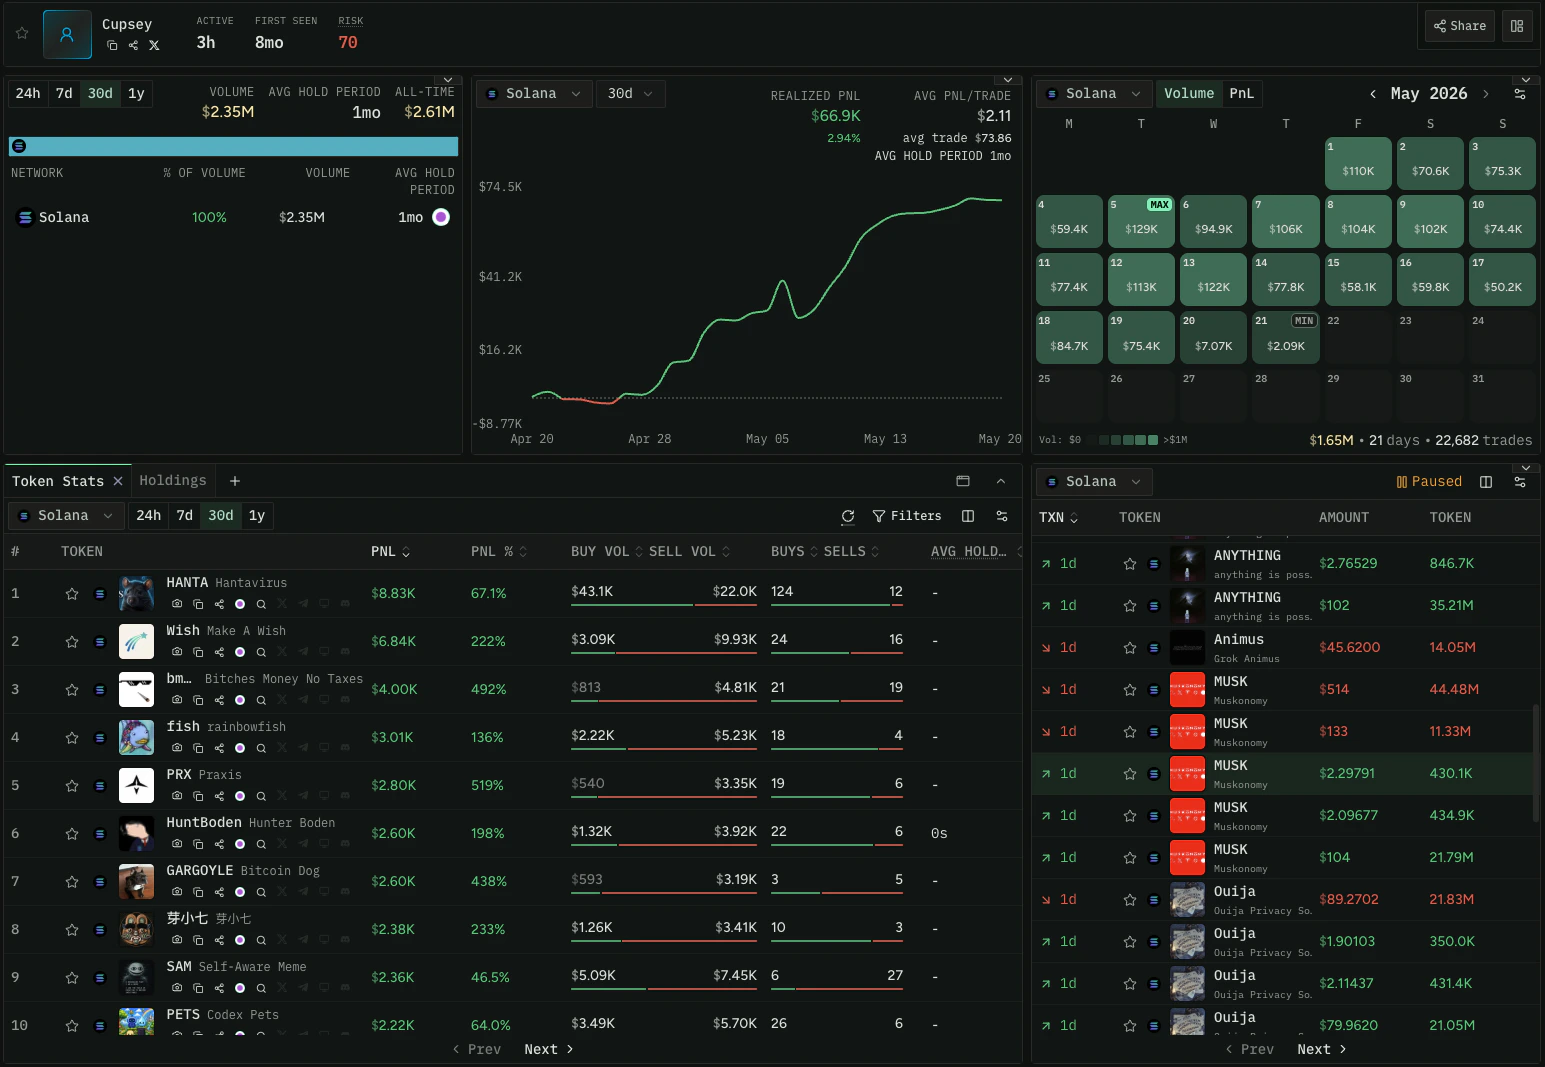 Wallet timeframes (such as PnL and volume windows) are rolling periods. 1D is the last
24 hours, 1W is the last 7 days, and so on. They do not start at a fixed date or time
of day.
## Identity and Stats Overview
`detailedWalletStats` is the core endpoint for a dashboard. A single call returns both
the wallet's identity (display name, Ethos credibility, linked socials, identity
labels) and its performance stats across rolling time windows, broken down by network.
This is what you render as the header and primary metrics of a trader profile.
[Test this query in the Explorer →](/explore)
```graphql theme={null} theme={null}
{
detailedWalletStats(input: {
walletAddress: "0xADDRESS"
includeNetworkBreakdown: true
}) {
walletAddress
lastTransactionAt
labels
scammerScore
botScore
statsDay30 {
statsUsd {
volumeUsd
realizedProfitUsd
realizedProfitPercentage
soldTokenAcquisitionCostUsd
heldTokenAcquisitionCostUsd
averageProfitUsdPerTrade
}
statsNonCurrency {
swaps
uniqueTokens
wins
losses
avgHoldPeriodSec
}
}
wallet {
address
displayName
avatarUrl
description
ethosScore
ethosLevel
ethosVerified
twitterUsername
discordUsername
telegramUsername
farcasterUsername
githubUsername
identityLabels
tokensCreatedCount
tokensMigratedCount
}
}
}
```
Available time windows: `statsDay1`, `statsWeek1`, `statsDay30`, `statsYear1`. Each
provides the same field set for that rolling window. Request only the windows you
need to display.
`tokensCreatedCount` and `tokensMigratedCount` are lifetime totals across all networks —
how many tokens the wallet has deployed, and how many of those graduated/migrated.
They're useful for flagging serial deployers on a profile header. Both are response
fields only, not filter inputs.
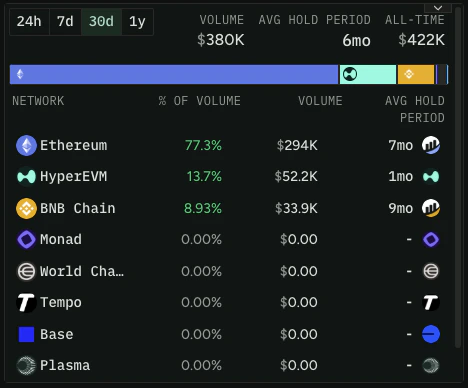
Setting `includeNetworkBreakdown: true` returns per-network volume and hold period
alongside the aggregate stats, which is useful when a wallet is active on multiple
chains:
Wallet timeframes (such as PnL and volume windows) are rolling periods. 1D is the last
24 hours, 1W is the last 7 days, and so on. They do not start at a fixed date or time
of day.
## Identity and Stats Overview
`detailedWalletStats` is the core endpoint for a dashboard. A single call returns both
the wallet's identity (display name, Ethos credibility, linked socials, identity
labels) and its performance stats across rolling time windows, broken down by network.
This is what you render as the header and primary metrics of a trader profile.
[Test this query in the Explorer →](/explore)
```graphql theme={null} theme={null}
{
detailedWalletStats(input: {
walletAddress: "0xADDRESS"
includeNetworkBreakdown: true
}) {
walletAddress
lastTransactionAt
labels
scammerScore
botScore
statsDay30 {
statsUsd {
volumeUsd
realizedProfitUsd
realizedProfitPercentage
soldTokenAcquisitionCostUsd
heldTokenAcquisitionCostUsd
averageProfitUsdPerTrade
}
statsNonCurrency {
swaps
uniqueTokens
wins
losses
avgHoldPeriodSec
}
}
wallet {
address
displayName
avatarUrl
description
ethosScore
ethosLevel
ethosVerified
twitterUsername
discordUsername
telegramUsername
farcasterUsername
githubUsername
identityLabels
tokensCreatedCount
tokensMigratedCount
}
}
}
```
Available time windows: `statsDay1`, `statsWeek1`, `statsDay30`, `statsYear1`. Each
provides the same field set for that rolling window. Request only the windows you
need to display.
`tokensCreatedCount` and `tokensMigratedCount` are lifetime totals across all networks —
how many tokens the wallet has deployed, and how many of those graduated/migrated.
They're useful for flagging serial deployers on a profile header. Both are response
fields only, not filter inputs.
Setting `includeNetworkBreakdown: true` returns per-network volume and hold period
alongside the aggregate stats, which is useful when a wallet is active on multiple
chains:
 **Hold period vs. hold time.** `avgHoldPeriodSec` estimates how long tokens are held
using average-cost accounting: sells realize the age of the sold cost basis, so unsold
holdings do not affect the result. It is a lower bound, capped at the window length,
and returns null when under \$1 of cost basis was sold in the window. Display it as an
indicator of conviction, not a precise duration.
## Calculate Wallet PnL
PnL (profit and loss) is central to a trader dashboard. For the concepts behind how
Codex calculates it, see the [Wallet PnL](/concepts/wallet-pnl) page. This section
covers the practical queries.
### Overall realized PnL
The `detailedWalletStats` example above already returns realized PnL through
`statsUsd.realizedProfitUsd` and `statsUsd.realizedProfitPercentage` for each window.
### Per-token PnL
To see how a wallet performed on a specific token, use `filterTokenWallets` filtered
to that wallet:
[Test this query in the Explorer →](/explore)
```graphql theme={null} theme={null}
{
filterTokenWallets(input: {
tokenIds: ["0xTOKEN_ADDRESS:NETWORK_ID"]
filtersV2: { walletAddress: { eq: "0xADDRESS" } }
}) {
results {
walletAddress
realizedProfitUsd30d
tokenBalance
tokenBalanceLive
purchasedTokenBalance
}
}
}
```
### Unrealized PnL
To estimate PnL on tokens still held, compare current value against acquisition cost:
```
Unrealized PnL = Current Balance Value - Acquisition Cost
```
Two fields from `filterTokenWallets` give you the inputs:
* `tokenAcquisitionCostUsd` — what the wallet paid for tokens it still holds
* Current value — multiply `tokenBalanceLive` by the token's current price (from
[`getTokenPrices`](/api-reference/queries/gettokenprices))
For an aggregate cost basis across all held tokens, `heldTokenAcquisitionCostUsd` from
`detailedWalletStats.statsUsd` is the single-field equivalent.
### PnL over time
For charting PnL progression, use `walletChart`. The `realizedProfitUsd` field in each
data point gives time-series PnL at your chosen resolution. See the
[Visualize Wallet Activity](#visualize-wallet-activity) section below.
## Visualize Wallet Activity
`walletChart` returns time-series data for rendering performance charts and heatmaps:
PnL progression, trading volume, and swap counts over time.
[Test this query in the Explorer →](/explore)
```graphql theme={null} theme={null}
{
walletChart(input: {
walletAddress: "0xADDRESS"
networkId: 1
range: {
start: 1739404800
end: 1742083200
resolution: "1D"
}
}) {
walletAddress
backfillState
range {
start
end
resolution
}
data {
timestamp
volumeUsd
realizedProfitUsd
swaps
}
}
}
```
**Hold period vs. hold time.** `avgHoldPeriodSec` estimates how long tokens are held
using average-cost accounting: sells realize the age of the sold cost basis, so unsold
holdings do not affect the result. It is a lower bound, capped at the window length,
and returns null when under \$1 of cost basis was sold in the window. Display it as an
indicator of conviction, not a precise duration.
## Calculate Wallet PnL
PnL (profit and loss) is central to a trader dashboard. For the concepts behind how
Codex calculates it, see the [Wallet PnL](/concepts/wallet-pnl) page. This section
covers the practical queries.
### Overall realized PnL
The `detailedWalletStats` example above already returns realized PnL through
`statsUsd.realizedProfitUsd` and `statsUsd.realizedProfitPercentage` for each window.
### Per-token PnL
To see how a wallet performed on a specific token, use `filterTokenWallets` filtered
to that wallet:
[Test this query in the Explorer →](/explore)
```graphql theme={null} theme={null}
{
filterTokenWallets(input: {
tokenIds: ["0xTOKEN_ADDRESS:NETWORK_ID"]
filtersV2: { walletAddress: { eq: "0xADDRESS" } }
}) {
results {
walletAddress
realizedProfitUsd30d
tokenBalance
tokenBalanceLive
purchasedTokenBalance
}
}
}
```
### Unrealized PnL
To estimate PnL on tokens still held, compare current value against acquisition cost:
```
Unrealized PnL = Current Balance Value - Acquisition Cost
```
Two fields from `filterTokenWallets` give you the inputs:
* `tokenAcquisitionCostUsd` — what the wallet paid for tokens it still holds
* Current value — multiply `tokenBalanceLive` by the token's current price (from
[`getTokenPrices`](/api-reference/queries/gettokenprices))
For an aggregate cost basis across all held tokens, `heldTokenAcquisitionCostUsd` from
`detailedWalletStats.statsUsd` is the single-field equivalent.
### PnL over time
For charting PnL progression, use `walletChart`. The `realizedProfitUsd` field in each
data point gives time-series PnL at your chosen resolution. See the
[Visualize Wallet Activity](#visualize-wallet-activity) section below.
## Visualize Wallet Activity
`walletChart` returns time-series data for rendering performance charts and heatmaps:
PnL progression, trading volume, and swap counts over time.
[Test this query in the Explorer →](/explore)
```graphql theme={null} theme={null}
{
walletChart(input: {
walletAddress: "0xADDRESS"
networkId: 1
range: {
start: 1739404800
end: 1742083200
resolution: "1D"
}
}) {
walletAddress
backfillState
range {
start
end
resolution
}
data {
timestamp
volumeUsd
realizedProfitUsd
swaps
}
}
}
```
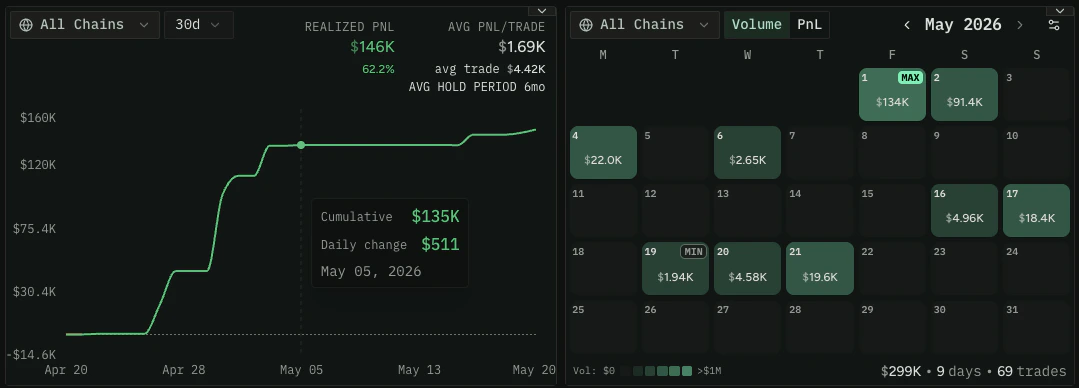 Available resolutions: `60` (1-hour candles), `240` (4-hour candles), `1D` (daily),
`7D` (weekly). Choose a resolution appropriate for your time range. Omit `networkId`
for cross-chain aggregated data.
## If Stats Look Empty
If `detailedWalletStats` or `walletChart` return empty or partial data, the wallet's
historical stats may still be processing. `walletChart` exposes the state directly in
its response through `backfillState`. To check it ahead of time on any wallet, use
`walletAggregateBackfillState`:
[Test this query in the Explorer →](/explore)
```graphql theme={null} theme={null}
{
walletAggregateBackfillState(input: { walletAddress: "0xADDRESS" }) {
walletAddress
status
}
}
```
The `status` enum has six values:
| Status | What it means |
| ------------------------- | ----------------------------------------------------------------------------------------------------------------------- |
| `BackfillComplete` | Historical stats are ready |
| `BackfillInProgress` | Currently processing, retry shortly |
| `BackfillRequestReceived` | Queued, will start soon |
| `BackfillNotFound` | Has not been started — trigger one with [`backfillWalletAggregates`](/api-reference/mutations/backfillwalletaggregates) |
| `BackfillCanceled` | Started, then canceled. Wallet may be flagged as a bot |
| `BackfillBlocked` | Blocked. Wallet may be flagged as a bot |
## Trading History
For a per-transaction view of everything a wallet has done, use
`getTokenEventsForMaker`. It returns the wallet's individual swap events with full
detail, including the global fees paid data on each event.
[Test this query in the Explorer →](/explore)
```graphql theme={null} theme={null}
{
getTokenEventsForMaker(query: {
maker: "0xADDRESS"
networkId: 1
}) {
items {
transactionHash
timestamp
eventType
eventDisplayType
token0SwapValueUsd
token1SwapValueUsd
maker
}
}
}
```
Available resolutions: `60` (1-hour candles), `240` (4-hour candles), `1D` (daily),
`7D` (weekly). Choose a resolution appropriate for your time range. Omit `networkId`
for cross-chain aggregated data.
## If Stats Look Empty
If `detailedWalletStats` or `walletChart` return empty or partial data, the wallet's
historical stats may still be processing. `walletChart` exposes the state directly in
its response through `backfillState`. To check it ahead of time on any wallet, use
`walletAggregateBackfillState`:
[Test this query in the Explorer →](/explore)
```graphql theme={null} theme={null}
{
walletAggregateBackfillState(input: { walletAddress: "0xADDRESS" }) {
walletAddress
status
}
}
```
The `status` enum has six values:
| Status | What it means |
| ------------------------- | ----------------------------------------------------------------------------------------------------------------------- |
| `BackfillComplete` | Historical stats are ready |
| `BackfillInProgress` | Currently processing, retry shortly |
| `BackfillRequestReceived` | Queued, will start soon |
| `BackfillNotFound` | Has not been started — trigger one with [`backfillWalletAggregates`](/api-reference/mutations/backfillwalletaggregates) |
| `BackfillCanceled` | Started, then canceled. Wallet may be flagged as a bot |
| `BackfillBlocked` | Blocked. Wallet may be flagged as a bot |
## Trading History
For a per-transaction view of everything a wallet has done, use
`getTokenEventsForMaker`. It returns the wallet's individual swap events with full
detail, including the global fees paid data on each event.
[Test this query in the Explorer →](/explore)
```graphql theme={null} theme={null}
{
getTokenEventsForMaker(query: {
maker: "0xADDRESS"
networkId: 1
}) {
items {
transactionHash
timestamp
eventType
eventDisplayType
token0SwapValueUsd
token1SwapValueUsd
maker
}
}
}
```
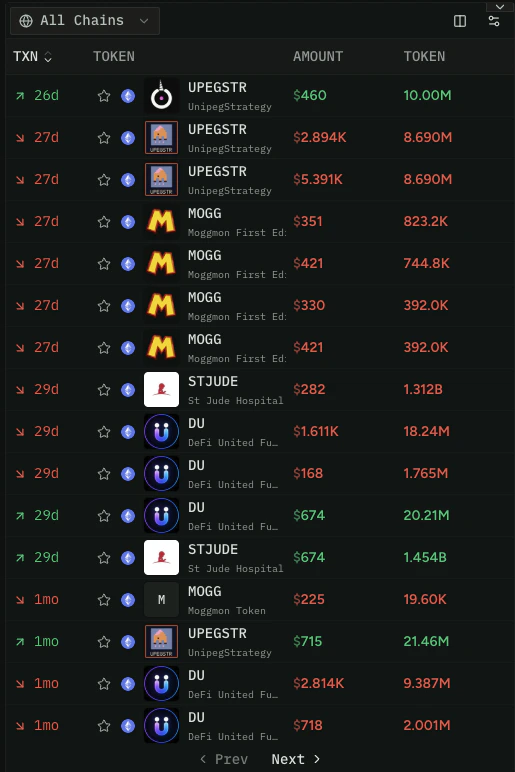 A single transaction may return multiple events for multi-hop swaps (Token A → B → C).
Disambiguate client-side using the transaction hash if you only want the end-to-end
swap.
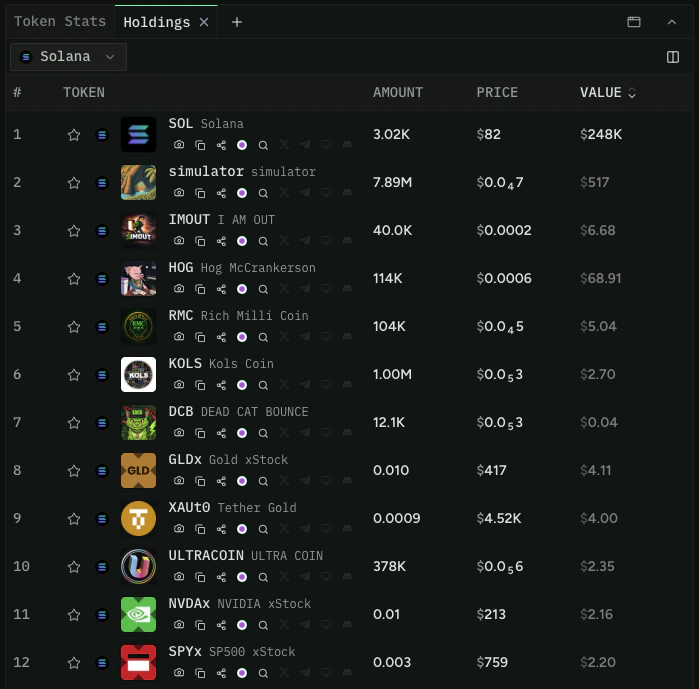
## Current Holdings
Complete the dashboard with a portfolio breakdown. `balances` returns the tokens a
wallet currently holds with current balance and metadata.
[Test this query in the Explorer →](/explore)
```graphql theme={null} theme={null}
{
balances(input: {
walletAddress: "0xADDRESS"
networks: [1, 8453]
removeScams: true
}) {
items {
tokenAddress
balance
shiftedBalance
token {
name
symbol
}
}
}
}
```
A single transaction may return multiple events for multi-hop swaps (Token A → B → C).
Disambiguate client-side using the transaction hash if you only want the end-to-end
swap.
## Current Holdings
Complete the dashboard with a portfolio breakdown. `balances` returns the tokens a
wallet currently holds with current balance and metadata.
[Test this query in the Explorer →](/explore)
```graphql theme={null} theme={null}
{
balances(input: {
walletAddress: "0xADDRESS"
networks: [1, 8453]
removeScams: true
}) {
items {
tokenAddress
balance
shiftedBalance
token {
name
symbol
}
}
}
}
```
 ENS names are not supported on `balances`. For EVM wallets, native token balances
require a network with traces enabled. On networks without traces, a native balance
may still update when the wallet makes a swap, but without trace data those values can
be updated inconsistently — treat them as approximate. Set `removeScams: true` to
filter out tokens flagged as scams.
## Bring It Together
A complete trader dashboard pulls from several endpoints:
* **Identity and performance:** `detailedWalletStats` for display name, Ethos score,
socials, identity labels, PnL, win rate, and hold period in one call
* **Per-token detail:** `filterTokenWallets` for token-specific performance
* **Visualization:** `walletChart` for time-series PnL, volume, and swap counts
* **History:** `getTokenEventsForMaker` for the per-transaction feed
* **Holdings:** `balances` for the current portfolio
## Related Endpoints
* [detailedWalletStats](/api-reference/queries/detailedwalletstats)
* [filterTokenWallets](/api-reference/queries/filtertokenwallets)
* [walletChart](/api-reference/queries/walletchart)
* [balances](/api-reference/queries/balances)
* [getTokenEventsForMaker](/api-reference/queries/gettokeneventsformaker)
* [walletAggregateBackfillState](/api-reference/queries/walletaggregatebackfillstate)
* [backfillWalletAggregates](/api-reference/mutations/backfillwalletaggregates)
* [getTokenPrices](/api-reference/queries/gettokenprices)
ENS names are not supported on `balances`. For EVM wallets, native token balances
require a network with traces enabled. On networks without traces, a native balance
may still update when the wallet makes a swap, but without trace data those values can
be updated inconsistently — treat them as approximate. Set `removeScams: true` to
filter out tokens flagged as scams.
## Bring It Together
A complete trader dashboard pulls from several endpoints:
* **Identity and performance:** `detailedWalletStats` for display name, Ethos score,
socials, identity labels, PnL, win rate, and hold period in one call
* **Per-token detail:** `filterTokenWallets` for token-specific performance
* **Visualization:** `walletChart` for time-series PnL, volume, and swap counts
* **History:** `getTokenEventsForMaker` for the per-transaction feed
* **Holdings:** `balances` for the current portfolio
## Related Endpoints
* [detailedWalletStats](/api-reference/queries/detailedwalletstats)
* [filterTokenWallets](/api-reference/queries/filtertokenwallets)
* [walletChart](/api-reference/queries/walletchart)
* [balances](/api-reference/queries/balances)
* [getTokenEventsForMaker](/api-reference/queries/gettokeneventsformaker)
* [walletAggregateBackfillState](/api-reference/queries/walletaggregatebackfillstate)
* [backfillWalletAggregates](/api-reference/mutations/backfillwalletaggregates)
* [getTokenPrices](/api-reference/queries/gettokenprices)