> ## Documentation Index
> Fetch the complete documentation index at: https://docs.codex.io/llms.txt
> Use this file to discover all available pages before exploring further.
# Charts
> Learn how to render a token chart with the Codex API
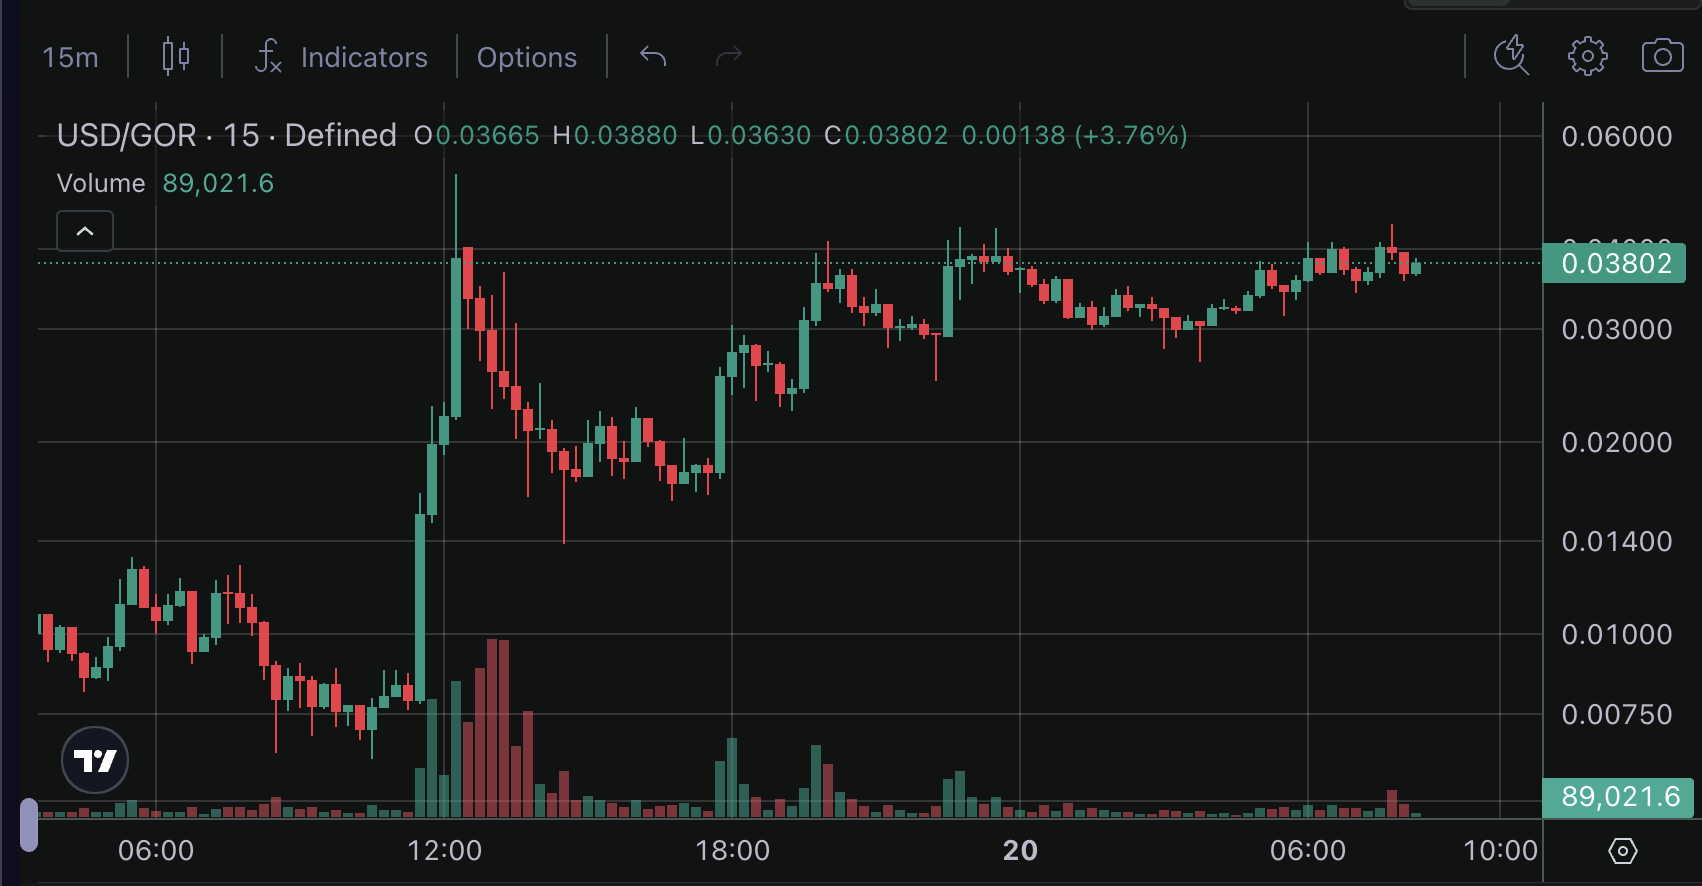
In this recipe we'll show you how to use the Codex api to render a token chart, complete with OHLCV data, and more.
This data powers the charts on [defined.fi](https://defined.fi/bsc/0xbb4cdb9cbd36b01bd1cbaebf2de08d9173bc095c).
 ## Fetch
Start by implementing the following query to fetch the OHLCV data for a given token.
[Test this query in the Explorer →](/explore)
```graphql theme={null} theme={null}
query ChartData {
getBars(
symbol: "0xbb4cdb9cbd36b01bd1cbaebf2de08d9173bc095c:56"
from: 1750353512
to: 1750439882
resolution: "1"
) {
o
h
l
c
t
volume
}
}
```
## Render
```json Sample Response expandable theme={null}
{
"data": {
"getBars": {
"o": [
639.962297445,
639.948026102,
],
"h": [
640.343357275,
640.081660228,
],
"l": [
639.795898952,
639.914833559,
],
"c": [
639.948026102,
639.983598149,
],
"t": [
1750353300,
1750353600,
],
"volume": [
"577495.066850454",
"302268.420570785",
]
}
}
}
```
The result uses the "response-as-a-table" pattern, which means you can use the `o`, `h`, `l`, `c`, `t`, and `volume` fields to render the chart. This is adapted from the TradingView documentation, and is intended to be used with their charting library [here](https://www.tradingview.com/charting-library-docs/latest/connecting_data/UDF/#response-as-a-table-concept).
## Realtime updates
Now that we have all the data we need to render a chart, we can use the [onTokenBarsUpdated](/api-reference/subscriptions/ontokenbarsupdated) subscription to get realtime updates for all pairs of a given token.
Note, you can also use [onBarsUpdated](/api-reference/subscriptions/onbarsupdated) to get realtime updates for a specific pair.
[Test this query in the Explorer →](/explore)
```graphql theme={null} theme={null}
subscription OnTokenBarsUpdated {
onTokenBarsUpdated(tokenId: "0xbb4cdb9cbd36b01bd1cbaebf2de08d9173bc095c:56") {
aggregates {
r1 {
usd {
o
h
l
c
t
volume
}
}
}
}
}
```
After receiving the realtime updates, you can use the `o`, `h`, `l`, `c`, `t`, and `volume` fields to update the chart.
## Confirmed vs. Unconfirmed data
The bars subscriptions accept an optional `commitmentLevel` argument. Omitting it gives you `confirmed` behavior by default.
* **`confirmed`** (default): best for charts where accuracy matters more than latency, like historical analysis or finalized trade data.
* **`processed`**: best for live trading UIs and sniper bots, where the lowest possible latency matters more than perfect accuracy. Processed events may later be reorged out.
**`processed` is currently available on Solana only.**
Event subscriptions (not bars) use a separate [`EventCommitmentLevel`](/api-reference/enums/eventcommitmentlevel) with its own values — `Confirmed`, `Processed`, and the even-earlier `Preprocessed`. See [Commitment levels](/concepts/subscriptions#commitment-levels) on the Subscriptions page for the tradeoffs.
## Aggregated Charts
Create token charts with aggregated data across all valid pairs with [getTokenBars](/api-reference/queries/gettokenbars). Note that this data has limited historical data, back to timestamp `1753121580`.
For real-time aggregate charts, subscribe to [onTokenBarsUpdated](/api-reference/subscriptions/ontokenbarsupdated).
You can refer to this [datafeed](https://gist.github.com/bradens/bfe449f8ea88fca8a1952cfe242b5e21) example using the SDK for `onTokenBarsUpdated` to get you started with a chart rendering subscription.
Check out all of our charting queries and subscriptions in the [api reference](/api-reference)
* [onTokenBarsUpdated](/api-reference/subscriptions/ontokenbarsupdated)
* [onBarsUpdated](/api-reference/subscriptions/onbarsupdated)
* [getBars](/api-reference/queries/getbars)
* [getTokenBars](/api-reference/queries/gettokenbars)
## Fetch
Start by implementing the following query to fetch the OHLCV data for a given token.
[Test this query in the Explorer →](/explore)
```graphql theme={null} theme={null}
query ChartData {
getBars(
symbol: "0xbb4cdb9cbd36b01bd1cbaebf2de08d9173bc095c:56"
from: 1750353512
to: 1750439882
resolution: "1"
) {
o
h
l
c
t
volume
}
}
```
## Render
```json Sample Response expandable theme={null}
{
"data": {
"getBars": {
"o": [
639.962297445,
639.948026102,
],
"h": [
640.343357275,
640.081660228,
],
"l": [
639.795898952,
639.914833559,
],
"c": [
639.948026102,
639.983598149,
],
"t": [
1750353300,
1750353600,
],
"volume": [
"577495.066850454",
"302268.420570785",
]
}
}
}
```
The result uses the "response-as-a-table" pattern, which means you can use the `o`, `h`, `l`, `c`, `t`, and `volume` fields to render the chart. This is adapted from the TradingView documentation, and is intended to be used with their charting library [here](https://www.tradingview.com/charting-library-docs/latest/connecting_data/UDF/#response-as-a-table-concept).
## Realtime updates
Now that we have all the data we need to render a chart, we can use the [onTokenBarsUpdated](/api-reference/subscriptions/ontokenbarsupdated) subscription to get realtime updates for all pairs of a given token.
Note, you can also use [onBarsUpdated](/api-reference/subscriptions/onbarsupdated) to get realtime updates for a specific pair.
[Test this query in the Explorer →](/explore)
```graphql theme={null} theme={null}
subscription OnTokenBarsUpdated {
onTokenBarsUpdated(tokenId: "0xbb4cdb9cbd36b01bd1cbaebf2de08d9173bc095c:56") {
aggregates {
r1 {
usd {
o
h
l
c
t
volume
}
}
}
}
}
```
After receiving the realtime updates, you can use the `o`, `h`, `l`, `c`, `t`, and `volume` fields to update the chart.
## Confirmed vs. Unconfirmed data
The bars subscriptions accept an optional `commitmentLevel` argument. Omitting it gives you `confirmed` behavior by default.
* **`confirmed`** (default): best for charts where accuracy matters more than latency, like historical analysis or finalized trade data.
* **`processed`**: best for live trading UIs and sniper bots, where the lowest possible latency matters more than perfect accuracy. Processed events may later be reorged out.
**`processed` is currently available on Solana only.**
Event subscriptions (not bars) use a separate [`EventCommitmentLevel`](/api-reference/enums/eventcommitmentlevel) with its own values — `Confirmed`, `Processed`, and the even-earlier `Preprocessed`. See [Commitment levels](/concepts/subscriptions#commitment-levels) on the Subscriptions page for the tradeoffs.
## Aggregated Charts
Create token charts with aggregated data across all valid pairs with [getTokenBars](/api-reference/queries/gettokenbars). Note that this data has limited historical data, back to timestamp `1753121580`.
For real-time aggregate charts, subscribe to [onTokenBarsUpdated](/api-reference/subscriptions/ontokenbarsupdated).
You can refer to this [datafeed](https://gist.github.com/bradens/bfe449f8ea88fca8a1952cfe242b5e21) example using the SDK for `onTokenBarsUpdated` to get you started with a chart rendering subscription.
Check out all of our charting queries and subscriptions in the [api reference](/api-reference)
* [onTokenBarsUpdated](/api-reference/subscriptions/ontokenbarsupdated)
* [onBarsUpdated](/api-reference/subscriptions/onbarsupdated)
* [getBars](/api-reference/queries/getbars)
* [getTokenBars](/api-reference/queries/gettokenbars)