> ## Documentation Index
> Fetch the complete documentation index at: https://docs.codex.io/llms.txt
> Use this file to discover all available pages before exploring further.
# walletChart
> Returns a chart of a wallet's activity.
## GraphQL
```
type Query {
# Requires a Growth or Enterprise plan.
walletChart(
input: WalletChartInput!
): WalletChartResponse
}
type WalletChartRange {
start: Int!
end: Int!
}
type WalletChartData {
timestamp: Int!
resolution: String!
volumeUsd: String!
volumeUsdAll: String!
realizedProfitUsd: String!
realizedProfitUsdExNative: String!
swaps: Int!
}
enum WalletAggregateBackfillState {
BackfillComplete
BackfillInProgress
BackfillCanceled
BackfillBlocked
BackfillRequestReceived
BackfillNotFound
}
type WalletChartResponse {
walletAddress: String!
networkId: Int
range: WalletChartRange!
resolution: String!
data: [WalletChartData!]!
backfillState: WalletAggregateBackfillState
}
input RangeInput {
start: Int!
end: Int!
}
input WalletChartInput {
walletAddress: String!
networkId: Int
range: RangeInput!
resolution: String!
}
```
### Example
Test this query in the Explorer →
```graphql theme={null}
{
walletChart(
input: {walletAddress: "J8hVkBNKobntWqLspa3yhXEkvb8vZ9S9NiHgirN9yvV3", networkId: 1399811149, range: {start: 1768958400, end: 1769563200}, resolution: "1D"}
) {
walletAddress
networkId
range {
start
end
}
resolution
data {
timestamp
resolution
volumeUsd
volumeUsdAll
realizedProfitUsd
swaps
}
backfillState
}
}
```
### Visual Example
`walletChart` powers PnL-over-time line charts and daily volume heatmaps for a single
wallet. Here's what the data looks like rendered on [re.defined.fi](https://re.defined.fi):
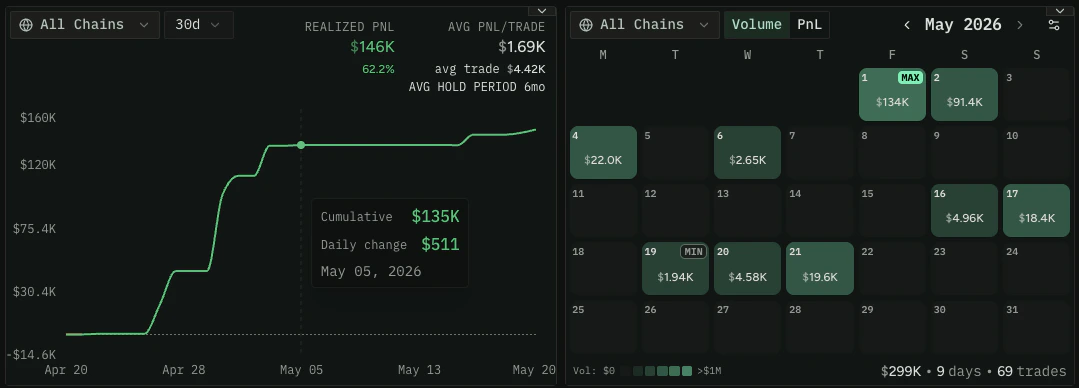 See the full implementation in the [Trader Dashboard](/recipes/wallets/trader-dashboard#visualize-wallet-activity)
recipe.
### Usage Guidelines
* Requires `walletAddress`, a `range` with `start`/`end` unix timestamps, and a `resolution` (`60`, `240`, `1D`, or `7D`)
* Optionally pass `networkId` to scope the chart to a single network — omit it for cross-chain aggregated data
* Each data point includes `volumeUsd`, `realizedProfitUsd`, and `swaps` for that time bucket
* `volumeUsdAll` includes volume from tokens sold where we may not have a price — use `volumeUsd` for more conservative figures
* Check `backfillState` to determine if historical data is fully available — `BackfillComplete` means all historical stats have been processed
### Troubleshooting Tips
`60` = 1-hour candles, `240` = 4-hour candles, `1D` = daily candles, `7D` = weekly candles. Choose a resolution appropriate for your time range — e.g., daily for a multi-week range, hourly for a few days.
Wallet historical data needs to be computed before it's available. `BackfillComplete` means data is ready. `BackfillInProgress` or `BackfillRequestReceived` means it's still processing — retry after a short wait. `BackfillCanceled` or `BackfillBlocked` typically means the wallet was flagged as a bot.
A negative `realizedProfitUsd` means the wallet realized a loss during that time bucket — tokens were sold for less than their acquisition cost. This only reflects closed positions; unrealized gains/losses on held tokens are not included.
`volumeUsd` only counts volume from tokens where we have a reliable USD price. `volumeUsdAll` additionally includes volume from tokens that were sold but for which we couldn't determine a USD price. For most use cases, `volumeUsd` is the safer metric.
### Related Recipes
* [Wallets](/recipes/wallets): Analyze wallet performance, discover top traders, and build portfolio views
See the full implementation in the [Trader Dashboard](/recipes/wallets/trader-dashboard#visualize-wallet-activity)
recipe.
### Usage Guidelines
* Requires `walletAddress`, a `range` with `start`/`end` unix timestamps, and a `resolution` (`60`, `240`, `1D`, or `7D`)
* Optionally pass `networkId` to scope the chart to a single network — omit it for cross-chain aggregated data
* Each data point includes `volumeUsd`, `realizedProfitUsd`, and `swaps` for that time bucket
* `volumeUsdAll` includes volume from tokens sold where we may not have a price — use `volumeUsd` for more conservative figures
* Check `backfillState` to determine if historical data is fully available — `BackfillComplete` means all historical stats have been processed
### Troubleshooting Tips
`60` = 1-hour candles, `240` = 4-hour candles, `1D` = daily candles, `7D` = weekly candles. Choose a resolution appropriate for your time range — e.g., daily for a multi-week range, hourly for a few days.
Wallet historical data needs to be computed before it's available. `BackfillComplete` means data is ready. `BackfillInProgress` or `BackfillRequestReceived` means it's still processing — retry after a short wait. `BackfillCanceled` or `BackfillBlocked` typically means the wallet was flagged as a bot.
A negative `realizedProfitUsd` means the wallet realized a loss during that time bucket — tokens were sold for less than their acquisition cost. This only reflects closed positions; unrealized gains/losses on held tokens are not included.
`volumeUsd` only counts volume from tokens where we have a reliable USD price. `volumeUsdAll` additionally includes volume from tokens that were sold but for which we couldn't determine a USD price. For most use cases, `volumeUsd` is the safer metric.
### Related Recipes
* [Wallets](/recipes/wallets): Analyze wallet performance, discover top traders, and build portfolio views